
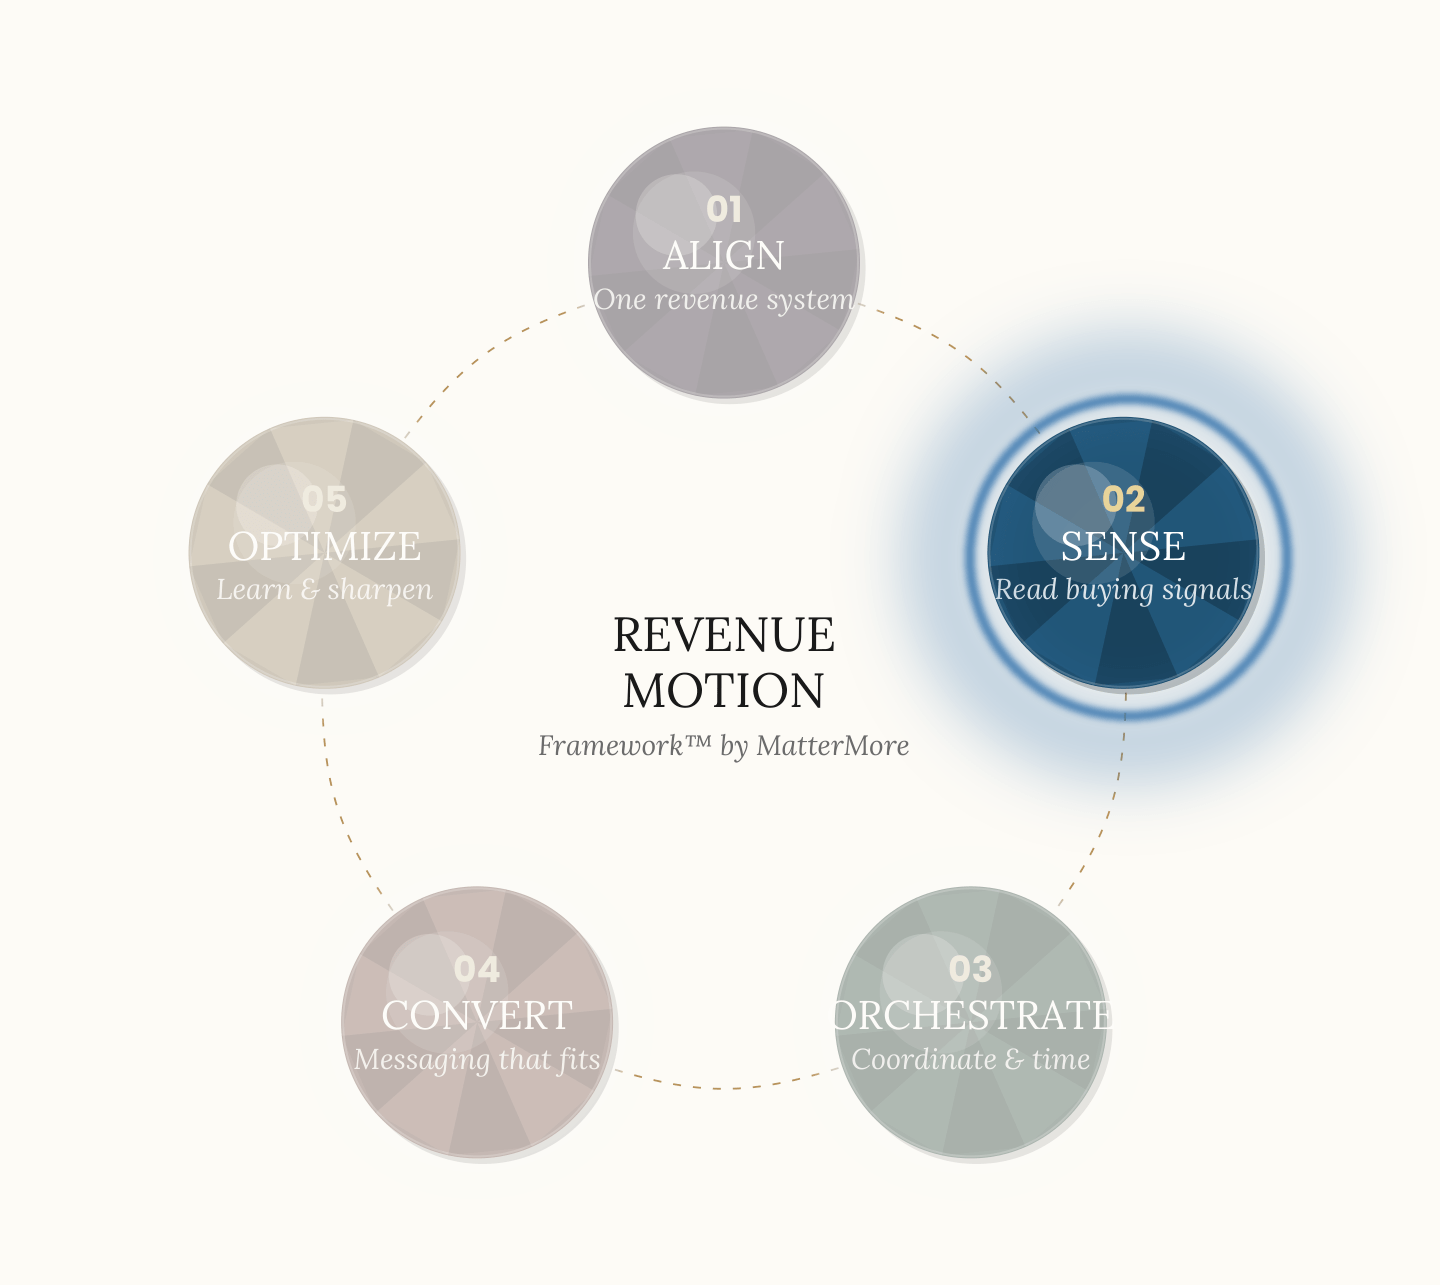
Sense — Phase 2 of the Revenue Motion Framework™
B2B buying signals: how to read intent in the dark funnel
Most of the enterprise buying journey is invisible. Sense is the discipline of reading the part you can’t see — without drowning in noise.
What you get
A working signal stack that surfaces in-market accounts before sales is invited in, and a shared definition of what counts as signal versus noise.
The problem this phase solves
The 80% of the journey you can't see
By the time an enterprise buyer fills in a form, the decision is already largely made. The buying group has done internal Slack debates, watched a competitor’s webinar, asked peers in a Slack community, downloaded analyst reports through someone else’s company, and quietly evaluated three vendors without any of them knowing. This is the dark funnel (covered in detail in this pillar post).
If your demand generation only counts the form-fills, you’re optimising for the last 20% of the journey. Sense is the discipline of reading the other 80% — turning passive evidence of buying activity into a list of accounts your team should be working right now, not in three weeks when the form arrives.
This isn’t about buying more data. It’s about deciding which data your team is willing to act on.
What "good" looks like
What Sense actually produces
Sense is built on three things working together:
- intent data (what companies are researching across the web),
- behavioural tracking (what’s happening on your own properties), and a
- scoring model that translates both into something actionable. None of these alone is sufficient — intent data without behavioural tracking misses your own product signals; behavioural tracking without intent data misses the dark funnel; either without a scoring model produces dashboards no one acts on.
The four artefacts below operationalise these three pillars and add the per-account number that everyone reads from.
- A valued signal taxonomy.
A written list of the behaviours, third-party signals, and account attributes you treat as evidence of intent — explicitly weighted.- Buying signals (pricing-page visits, demo requests, comparison-page reads, RFP language) carry the highest weight.
- Evaluation signals (analyst reports, “vs” searches, peer-review reads) sit below them.
- Learning signals (educational content, top-of-funnel webinars, category blog reads) sit below those.
- Background signals (job changes, funding events, tech-stack shifts) are context, not action. A buying signal might be worth 5× a learning signal in your scoring model — make that explicit.
- A source map.
For each signal in the taxonomy, where does it come from- First-party (your site, your product, your CRM — behavioural tracking),
- second-party (G2, partner data, review activity),
- third-party (Bombora, 6sense, ZoomInfo intent, LinkedIn engagement — intent data). The key is account-level aggregation: rather than tracking what one person did, you track what an entire account is doing across all touchpoints. No source = the signal isn’t real.
- A fourth source category is now emerging: AI-mediated signals — mentions of your brand, your category, or your distinctive framework concepts surfaced in AI search platforms’ answers (ChatGPT, Claude, Gemini, Perplexity). The measurement infrastructure for these is still imperfect, but the citations themselves are the first read on whether your perspective is in the buyer’s AI-mediated research conversation — a leading indicator that didn’t exist three years ago. See AI Search and the Dark Funnel for the operating-model implications.
- An Account Interest Rating (AIR).
A weighted, recency-decayed, combination-aware score from 0 to 100, calculated at account level. The AIR rewards: (a) higher-value signal types, (b) recency, (c) multiple signal types firing in the same window, and (d) multiple roles at the same account being active (a single curious user is noise — three roles from the buying group concentrating in the same week is a spike). Thresholds: 70+ = spiking (act now), 40–70 = warming (engage warmly), <40 = background (don’t interrupt). - A unified dashboard with role-level decomposition, surfaced differently to each operational role.
Every spiking account is visible to three roles, each with a different view of the same data: the Account Manager (AM) sees their own territory accounts ranked by AIR as context — “TechCo is spiking 84 — pricing-page visits + RFP-language search, driven by VP Engineering (3 sessions) and CFO (2 sessions) in the last 6 days.” Insight, not a task. The Business Developer (BDR) sees a forward-look of which Spotted Opportunities are likely to produce a qualification packet for review in the coming weeks. The Marketing Account Developer (MAD) sees a working queue — which Spotted accounts need development work this week, with the topic and active roles surfaced as a starting point for the development play. Same data, three views, three different next moves. The dashboard makes the operating model visible to everyone who participates in it.
If these four artefacts don’t exist, you don’t have a signal stack. You have a dashboard.
Sub-capabilities
The four capabilities that make Sense work
Capability 1 — Signal literacy. Most “intent data” is noise dressed as signal. A G2 category browse from one user at a 5,000-person company is not a buying signal. A G2 comparison-page visit from three users at the same account in two weeks usually is. The skill is knowing the difference before you commit to acting on it.
Capability 2 — First-party signal harvesting. Your own systems — product telemetry, pricing-page visits, partner-led intros, customer-success expansion conversations — are usually a richer signal source than any third-party tool. They’re also the least exploited. Start here before buying anything new. First-party signals are also what makes the Marketing Account Developer’s work possible: developing a Spotted Opportunity into a pre-opportunity (a fully-built account profile with the buying group mapped, ready for the BDR to review and approve) needs first-party engagement evidence, not just third-party intent.
Capability 3 — Account-level scoring (the AIR model). A single signal is rarely enough. The accounts worth working show up across two or three signal types, from multiple roles, in a short window. Translating that pattern into a single per-account number — the Account Interest Rating (0–100) — is what turns intent data from “interesting” into “actionable.” The model has to be weighted (buy > evaluation > learning > background), decayed (recent > old), and concentration-aware (three roles signalling > one role signalling three times).
Capability 4 — Subtraction (again). A signal stack with 40 signals is not better than one with 6. More signals create more false positives, which trains sales to ignore the list, which kills the entire phase. Ruthless prioritisation of whichsignals matter is more valuable than buying another tool.
A short example
What this looked like in practice
A B2B SaaS team had a six-figure annual contract with two intent-data vendors. The data was flowing. Sales wasn’t acting on it. When we audited why, the answer was simple: 2,400 “in-market” accounts surfaced per month, scored on a flat “high / medium / low” intent rating, with no distinction between someone reading a thought-leadership blog and someone benchmarking pricing against a named competitor. Sales had bandwidth for maybe 200 accounts. So they worked none of them.
Phase 2 here wasn’t about adding signals. It was about valuing them, then collapsing them into something a seller could actually use.
Step 1 — We weighted the signal taxonomy.
Buying signals (pricing-page repeat visits, demo requests, RFP-language search, competitor comparison-page reads) were given a 5× weight. Evaluation signals (analyst-report reads, “vs.” searches, peer-review activity) a 3× weight. Learning signals (top-of-funnel blogs, intro webinars) a 1× weight. Background signals (job changes, funding rounds) carried no score on their own but acted as a multiplier when paired with anything else.
Step 2 — We built the Account Interest Rating (AIR).
A 0–100 score per account, calculated nightly. The model rewarded (a) higher-value signal types, (b) recency (anything older than 30 days decayed at half-life), (c) signal diversity (three signal types in one window scored higher than the same type firing three times), and (d) role concentration (three different roles from the buying group active in one week pushed the score harder than one curious user with twenty page-views). Thresholds: AIR 70+ = spiking, 40–70 = warming, <40 = background noise.
Step 3 — A unified dashboard surfaced the AIR to two audiences.
Sales (account managers) saw the AIR on their target accounts as an insight — “TechCo is at 84, up 22 in 7 days, driven by pricing + RFP-language reads from VP Engineering and CFO.” Context, not a task. The Marketing Account Developer saw the same accounts as a queue — “TechCo just crossed into spiking; develop this one this week.” For any account in the spiking band, the dashboard surfaced three things to both audiences:
- the topic driving the spike (e.g. “pricing + competitor comparison”),
- which roles were most active (“VP Engineering — 3 sessions, CFO — 2 sessions, in the last 6 days”), and — for the MAD —
- the recommended development play (a templated motion tied to that specific signal pattern). No more “TechCo has high intent.” Instead: a clear next move for the role responsible for development, and clean visibility for the role responsible for closing.
How the dashboard then connects to action — what plays fire on a spike, who runs them, and how accounts move from Spotted to Qualified to Accepted Opportunity — is the work of Phase 3 (Orchestrate)
The result. The “act now” list dropped from 2,400 to about 25–40 spiking accounts at any given time, distributed across the MAD’s queue and visible to sales as context. Pipeline from intent-sourced accounts went from effectively zero to 22% of new ARR within two quarters — but only after Phase 3 was built around the AIR. Sense produced the right signal; Orchestrate turned it into pipeline.
Two things to notice. First: the intervention was less data, more discipline — same vendors, sharper model. Second: the AIR and the unified dashboard were the two changes that mattered. A scoring model that nobody sees is just a spreadsheet. The dashboard is what makes Sense operational — and the action layer downstream of it is where Sense connects to the rest of the framework.
Where to go from here
Once Sense is working
A working Sense capability becomes the input to Phase 3 (Orchestrate) — the question of what marketing and sales do, together, when a signal fires. Without Sense, Orchestrate is improvisation.
Three ways to take this further:
- Read the full chapter — Phase 2 is covered in depth in the Revenue Motion Framework™ ebook, including the signal taxonomy template and the correlation logic worked example. Buy the ebook (€79 ex VAT) →
- Implement it — the Implementation Toolkit adds the 90-Day Action Plan deck, so you can audit your current signal stack and rebuild it as a structured sprint. Get the Toolkit (€149 ex VAT) →
- Work through it together — book a Strategic Review and we’ll audit your signal stack in a focused session. Request a Strategic Review →
Previous phase: ← Phase 1 — Align
Next phase: Phase 3 — Orchestrate →
FAQ
Most teams have more first-party signal than they’re using. Product telemetry, pricing-page visits, repeat visits from multiple users at the same domain, and CRM activity already tell you a lot. Start there, prove the discipline, then layer third-party data on top.
Intent data is one input. ABM is a delivery model. Sense is the discipline of deciding which signals — intent, behaviour, or otherwise — your team will commit to acting on, and what happens when they fire. It’s the operating system; intent data and ABM are apps that run on it.
Most teams start with six to ten signals total across all tiers. More than fifteen and you’ll spend more time managing the stack than acting on it.
Quarterly is the minimum. The signals that mattered last quarter often don’t match what’s converting this quarter. Tie the recalibration to the same cadence as the Align refresh (Phase 1).
Treating Sense as a tooling problem instead of a discipline problem. New vendor, same disorganised list. The fix is upstream — Align (Phase 1) must be sharp before any signal data has meaning.